
Table of Links
3. The GAR(1) Model
3.1. Model and Stationary Solution
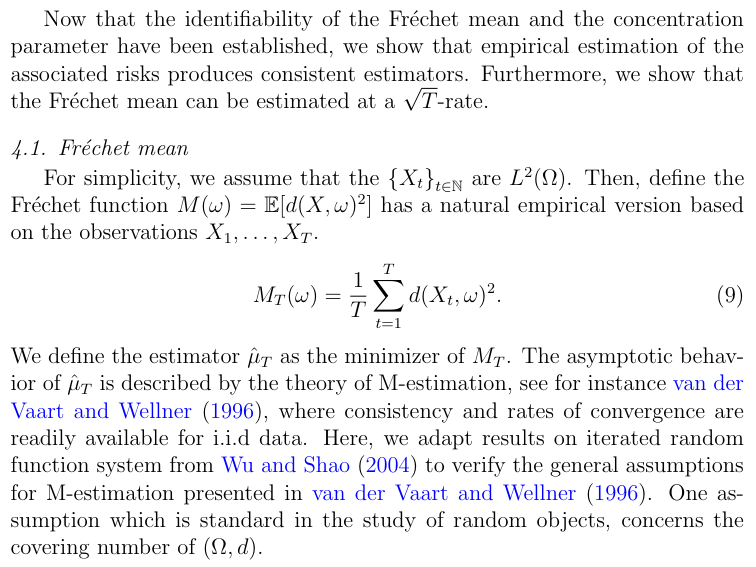
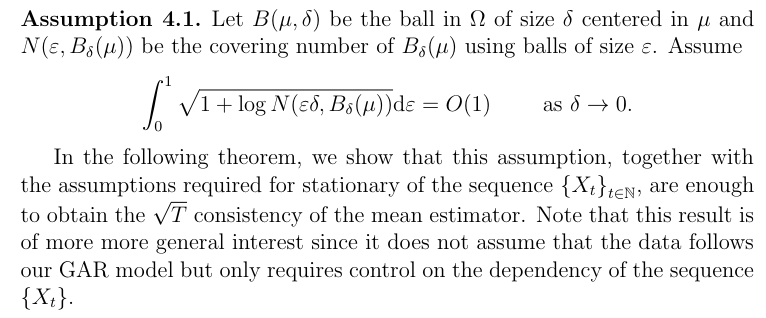
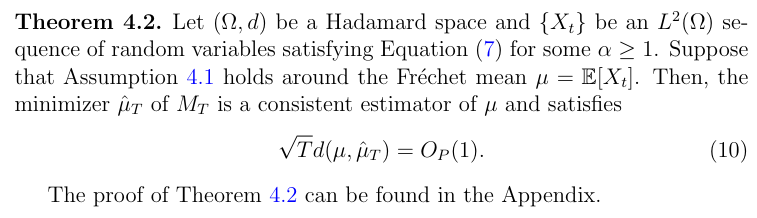
4. Estimation of model parameters and 4.1. Fréchet mean
5. Testing for the absence of serial dependence
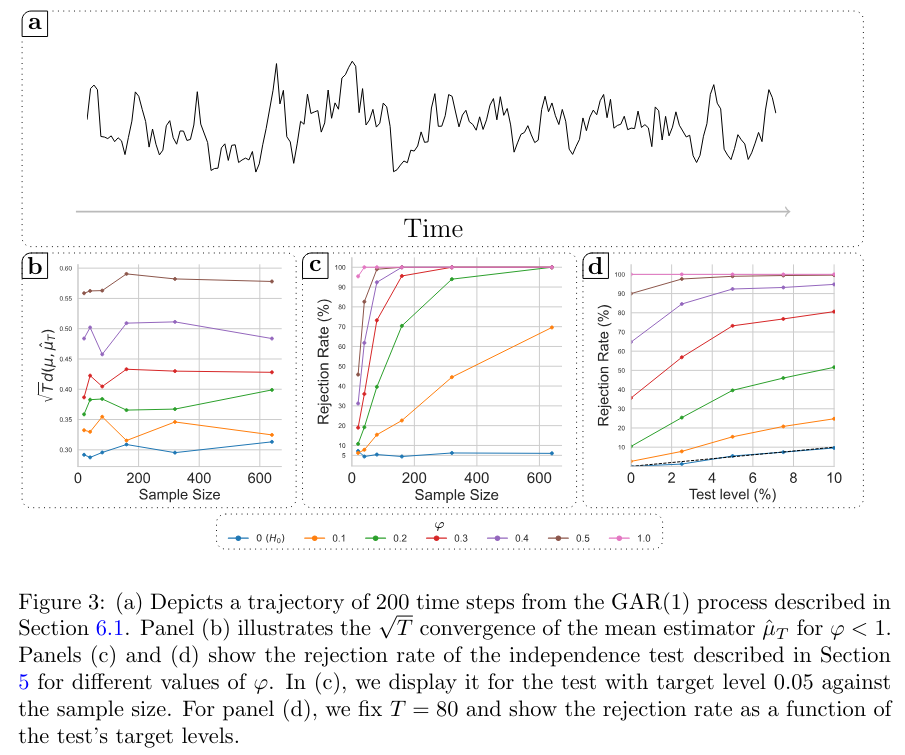
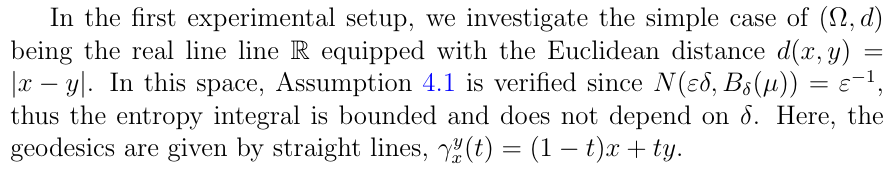
6.1. R with multiplicative noise
6.2. Univariate distributions with a density
Appendix A. General results in Hadamard spaces
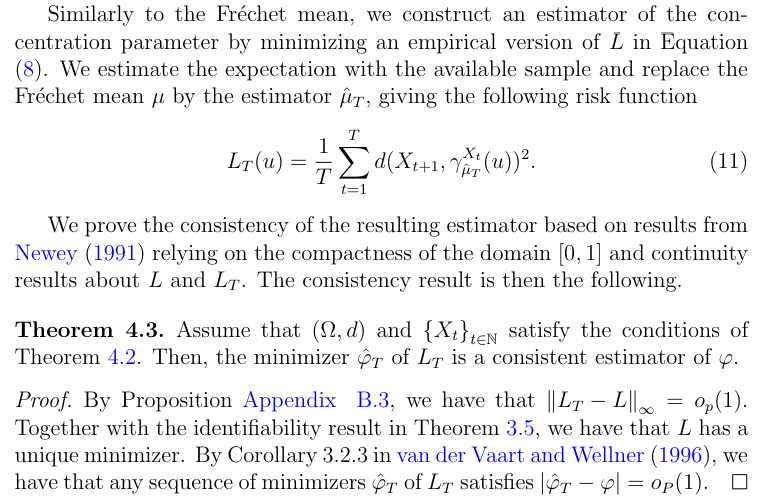
4. Estimation of model parameters
4.2. Concentration parameter
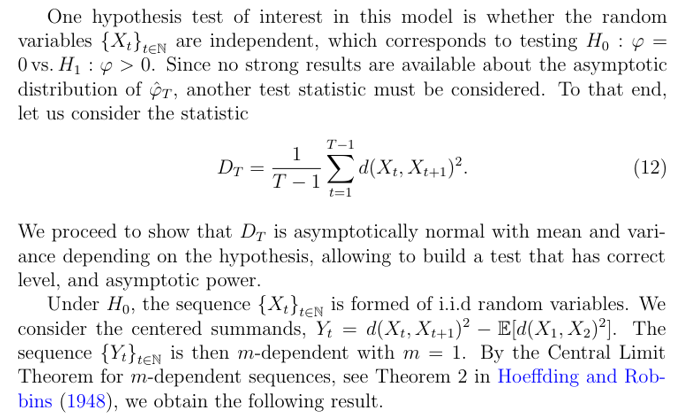
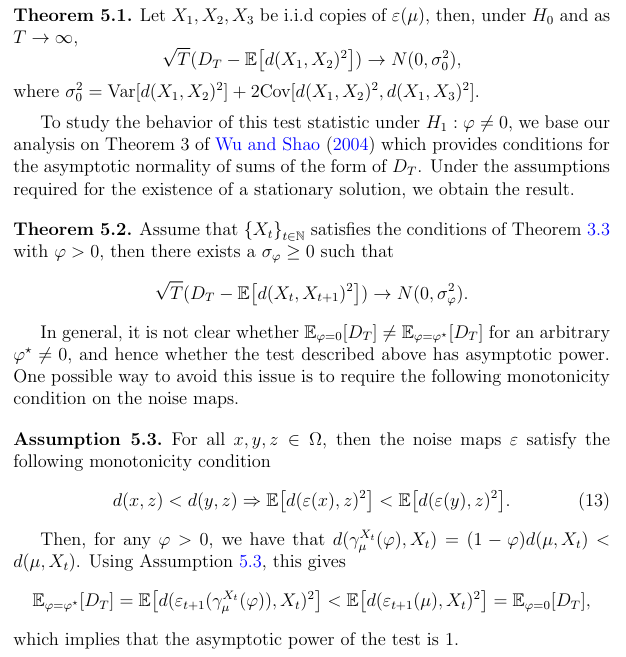
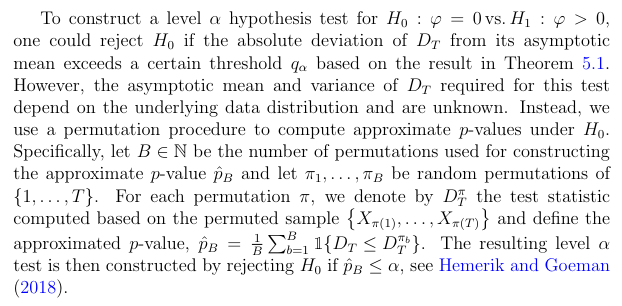
5. Testing for the absence of serial dependence
6. Numerical experiments
We study three scenarios of time series following the GAR(1) model (5). The first example is that of the real line R equipped with the standard Euclidean distance, with a multiplicative noise model. For the second example, we consider the space of density distributions over the real line equipped with the 2-Wasserstein distance, described in Example 2.4, with a geodesic noise model that we describe later. For the last example, we consider SPD matrices with the Log-Cholesky metric from Example 2.5 with a noise model based on the Lie group structure defined in Lin (2019).
All simulations and analyses are done in Python. The code to reproduce the experiments and figures is available online[1].
6.1. R with multiplicative noise
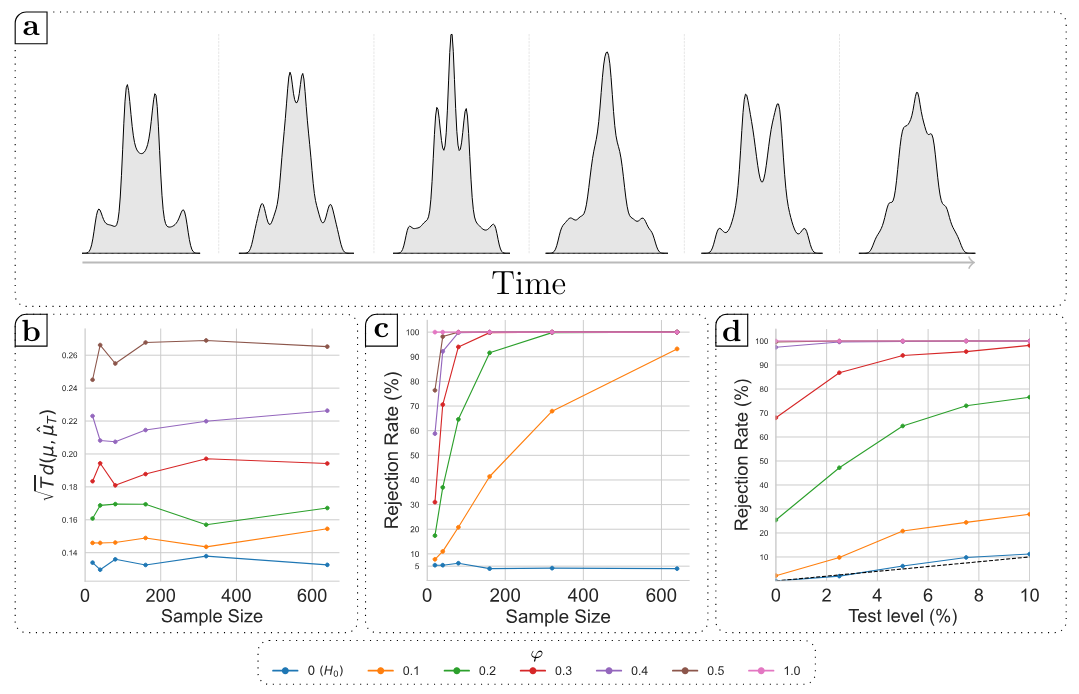
6.2. Univariate distributions with a density
6.3. SPD Matrices
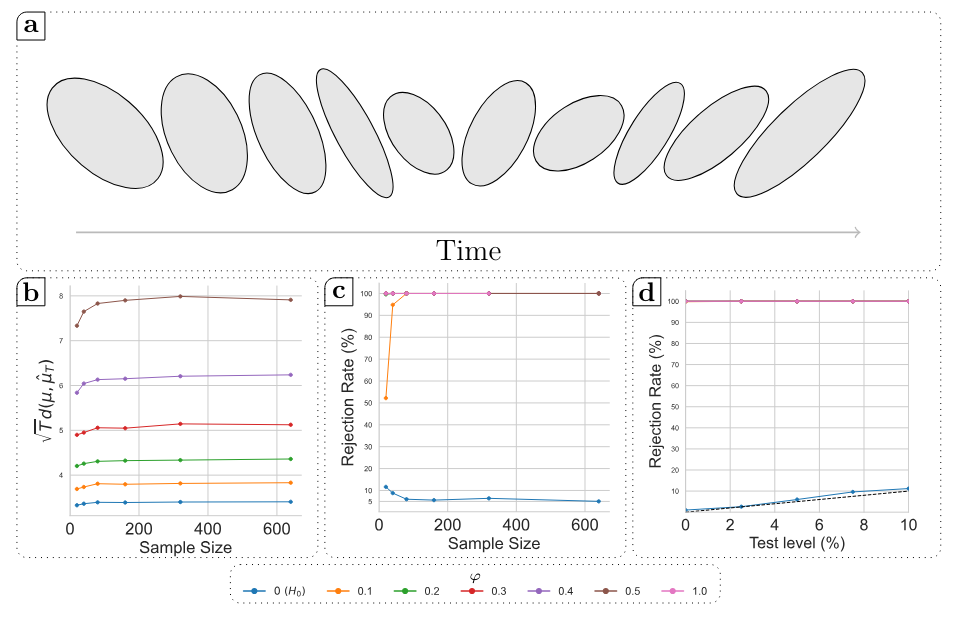
Here, Figure 5 shows similar results as in the other two experimental settings. The convergence rate proved in Theorem 4.2 is confirmed in panel (a). We observe that in this setting, the stability of the error curves seems to indicate an early attainment of the asymptotic regime. Similarly, we observe in panels (c) and (d) that the test exposes the right level and high power, already at small sample sizes for all tested values of φ.
Authors:
(1) Matthieu Bult´e, Department of Mathematical Sciences, University of Copenhagen, and Faculty of Business Administration and Economics, Bielefeld University;
(2) Helle Sørensen, Department of Mathematical Sciences, University of Copenhagen.
This paper is
[1] https://github.com/matthieubulte/GAR