

Authors:
(1) Rahul Vishwakarma, Big Data Analytics & Solutions Lab, Hitachi America Ltd. Research & Development, Santa Clara, CA, USA ([email protected]);
(2) Ravigopal Vennelakanti, Big Data Analytics & Solutions Lab, Hitachi America Ltd. Research & Development, Santa Clara, CA, USA ([email protected]).
Table of Links
VI. Conclusions and References
**Abstract—**This paper provides a report on our solution including model selection, tuning strategy and results obtained for Global Road Damage Detection Challenge. This Big Data Cup Challenge was held as a part of IEEE International Conference on Big Data 2020. We assess single and multi-stage network architectures for object detection and provide a benchmark using popular state-of-the-art open-source PyTorch frameworks like Detectron2 and Yolov5. Data preparation for provided Road Damage training dataset, captured using smartphone camera from Czech, India and Japan is discussed. We studied the effect of training on a per country basis with respect to a single generalizable model. We briefly describe the tuning strategy for the experiments conducted on two-stage Faster R-CNN with Deep Residual Network (Resnet) and Feature Pyramid Network (FPN) backbone. Additionally, we compare this to a one-stage Yolov5 model with Cross Stage Partial Network (CSPNet) backbone. We show a mean F1 score of 0.542 on Test2 and 0.536 on Test1 datasets using a multi-stage Faster R-CNN model, with Resnet-50 and Resnet-101 backbones respectively. This shows the generalizability of the Resnet-50 model when compared to its more complex counterparts. Experiments were conducted using Google Colab having K80 and a Linux PC with 1080Ti, NVIDIA consumer grade GPU. A PyTorch based Detectron2 code to preprocess, train, test and submit the Avg F1 score to is made available at https://github.com/vishwakarmarhl/rdd2020
I. INTRODUCTION
Roads are a critical mobility infrastructure asset that requires condition assessment and monitoring. This was traditionally done by manual survey and expensive inspection methods. The high cost and issues in existing practices like manual labor, specialized inspection equipment’s, subject knowledge and logistical delays in assessment are prohibitive. To address this issue, automated image processing from an off-the-shelf smartphone camera has shown to be increasingly effective in visual damage detection [1].
Deep learning based Object detection and localization techniques have shown immense progress in the last decade. Convolutional Neural Network (CNN) using supervised learning approach is applied to image recognition domain that are difficult to model using conventional methods. ImageNet [3] challenge accelerated the object detection task and by year 2015 exceeded human ability. The objective of this work is to assess object detection methods and run experiments to train a damage detection model with the most accurate and generalizable architecture. We achieve the following in this paper.
• Pre-processing to achieve accurate detections
• Train a generalizable model that can be transferred across countries. Contrast it with a dedicated model per country approach.
• Experiment and evaluate single and multi-stage object detectors for accurate detection
• Assess the progress, hyper-parameters and accuracy of various models
The following section describes the data, experiments and analysis to achieve the reported score.
II. DATASET
The Road Damage Dataset 2020 [2] was curated and annotated for automated inspection. This multi-country dataset is released as a part of IEEE Big Data Cup Challenge [23]. The task is to detect road damages at a global scale and report the performance on Test 1 and Test 2 datasets.
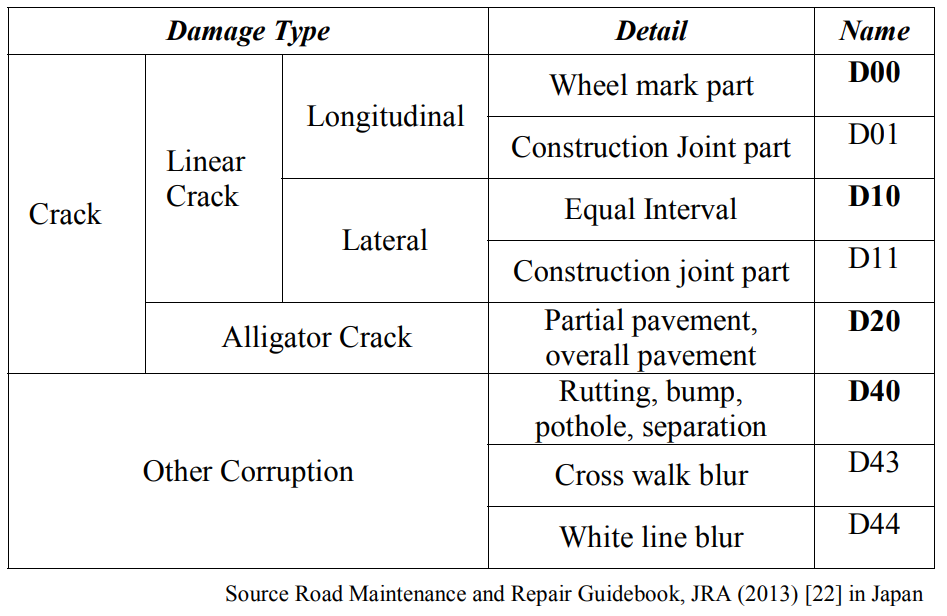
The damages vary across countries. To generalize the damage category detection in Table I, classes considered for the analysis are; D00: Longitudinal Crack, D10: Transverse Crack, D20: Alligator Crack, D40: Pothole. Test 1 and Test 2 data is provided by the challenge [23] committee for evaluation and submission. Upon submission an Average F1 score is added to the private leaderboard as well as a public leaderboard if it exceeds all the previous scores in our private leaderboard.
A. Global Road Damage Dataset
The latest dataset is collected from Czech Republic and India in addition to what was made available by GIS Association of Japan. The 2020 dataset provides training images of size 600x600 with damages as a bounding box with associated damage class. Class labels and bounding box coordinates, defined by four numbers (xmin, ymin, xmax, ymax), are stored in the XML format as per PASCAL VOC [12].
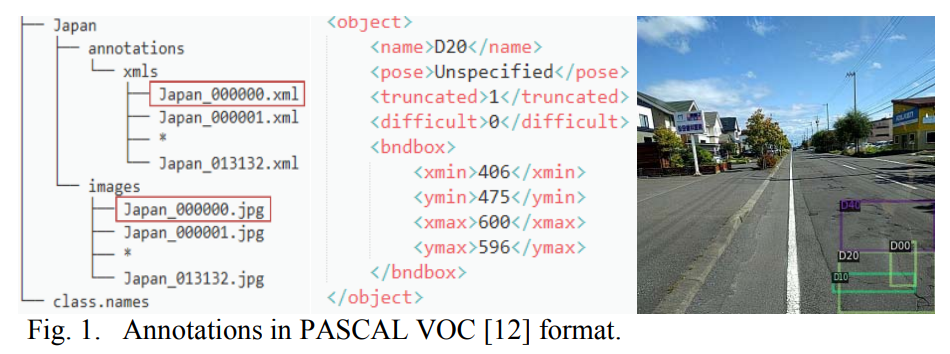
The provided training data has 21041 total images. It consists of 2829 images from Czech (CZ); 10506 from Japan (JP); and 7706 from India (IN) with annotations stored in individual XML files. In Fig. 1, We can see the file structure, bounding box in xml tags and corresponding image example.
The shared Test data are divided into two sets. Test 1 consists of 349 Czech, 969 India and 1313 Japan Road images without annotated ground truth. Test 2 consists of 360 Czech, 990 India and 1314 Japan Road images without annotated ground truth. The detection results on these test images is submitted to the challenge [23] for Avg F1 score evaluation.
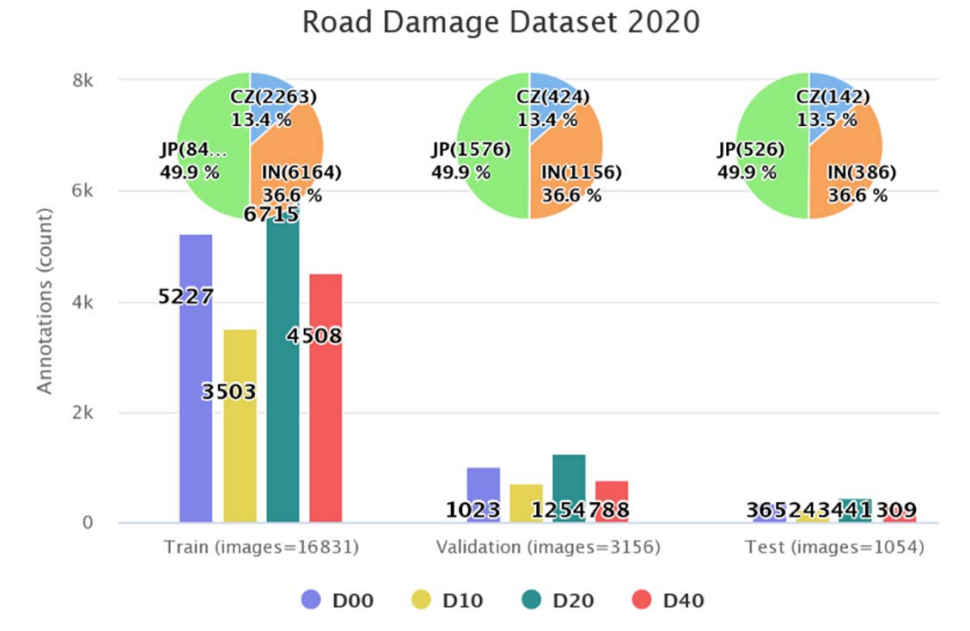
In order to run the experiments, we split the given training dataset proportionally into 80:15:5 :: Train (T):Val (V):Test (T) data. This gives us the final image & annotations count in Fig. 2 that will be used for training and tuning.
As we fine tune the models, we need to create composite datasets with Train+Test (T+T) and Train+Val (T+V) dataset composition. This will help model use entire data for learning and evaluation.
B. Evaluation Strategy
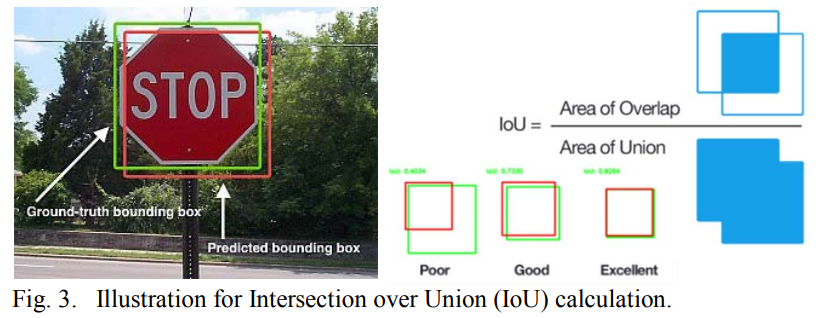
Evaluation strategy includes matching of the predicted class label for the ground truth bounding box and that the predicted bounding box has over 50% Intersection over Union (IoU) in area. Precision and recall are both based on evaluating Intersection over Union (IoU), which is defined as the ratio of the area overlap between predicted and ground-truth bounding boxes by the area of their union.
The evaluation of the match is done using the Mean F1 Score metric. The F1 score, commonly used in information retrieval, measures accuracy using the statistics of precision p and recall r. Precision is the ratio of true positives (tp) to all predicted positives (tp + fp) while recall is the ratio of true positives to all actual positives (tp + fn). Maximizing the F1-score ensures reasonably high precision and recall.
The F1 score is given by:
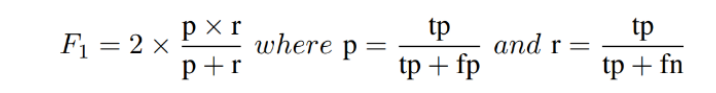
Avg F1 score serves as a balanced metric for precision and recall. This is the metric we obtain in our private leaderboard, upon submitting the evaluation results on Test 1 or Test 2 datasets.
This paper is